Here is today’s bold and dangerous statement here on Dirty Feed: Danger Mouse did not get viewing figures of 21 million viewers in 1983.
To me, this statement would seem to be self-evident. The idea that Danger Mouse beat every single episode of Coronation Street broadcast that year would seem to be highly dubious. Many others, however, seem to disagree. Take this BBC News article from 2013, “How Danger Mouse became king of the TV ratings”:
“A curiously British cartoon, it parodied James Bond and was influenced by Monty Python’s anarchic humour.
Thirty years ago children’s cartoon Danger Mouse topped the TV ratings, beating even Coronation Street. But what happened to the legendary Manchester animation house Cosgrove Hall Films, which created the rodent secret agent?
Voiced by Only Fools And Horses star David Jason, Danger Mouse was the flagship of Cosgrove Hall Films, based in a quirky studio in the Manchester suburb of Chorlton-cum-Hardy.
Vibrant, surreal and deliciously silly, an astonishing 21 million viewers reportedly tuned in to watch it in 1983, a record for a children’s programme which has yet to be beaten.”
But the BBC are far from alone in reporting this. A quick Google search reveals this factoid to be absolutely everywhere. Sure enough, many people clearly grabbed it from the 2013 BBC News piece, as in this extremely recent piece in the Manchester Evening News, “Calls for a Danger Mouse statue in Chorlton”:
“A resident has called for a Danger Mouse statue to be erected in the centre of Chorlton.
A post by Andrew Jones in the Facebook group Chorlton M21 shared the idea of crowdfunding for a Bronze statue of the animated mouse on the corner of Barlow Moor Road and Wilbraham Road.
The idea proved popular and was met with more than 150 likes.
Silly, exciting and with a huge amount of custard, Danger Mouse was a huge success on screen, and in 1983, once racked up 21 million viewers, beating Corrie, and smashing records for the highest viewings of a children’s show.”
Other sources are rather more troubling. When I first started researching this article, I thought the 21 million figure might just be traced back to an over-enthusiastic fan, and we could just have a jolly good laugh at their expense. Unfortunately, this is very much not the case. In 2020, The Guardian posted “How we made Danger Mouse – by David Jason and Brian Cosgrove”.
And what does Brian Cosgrove, co-creator of Danger Mouse have to say?
“I worked with a small group of animators. We had certain rules. Danger Mouse was a mouse living in a world of humans. When he drives around London, his car is mouse-sized – he could get stepped on! That’s what I like about animation: you can ignore common sense. We never talked down to our audience. Children were mature people, just small. We didn’t realise were making something that would achieve such a level of affection. It certainly wasn’t due to the quality of the animation, but I think Danger Mouse had heart. At one point in the early 80s our viewing figures – 21 million – were higher than Coronation Street’s.”
Ah. Erm. Hmmmm. OK.
When the co-creator of the show is literally stating the 21 million viewing figure as fact, the onus is on me to prove that the figure is false, rather than pointing and saying “don’t be ridiculous”. And sure, we can easily have a first stab at that. If we look at the Top 10 rated programmes in 1983 from BARB, we can see that the highest rated programme that year was Coronation Street… with viewing figures of 18.45 million. And 18.45 million is a figure which is lower than 21 million, I am fairly confident in stating.
But I think we need to go deeper. Where exactly does this 21 million figure come from?
* * *
I’m not sure I can answer that for sure. But I can pinpoint a relatively early reference to it. Much earlier than 2013, at least.
From the BBC itself, we have this image gallery published in 2006, which confidently states:
“Danger Mouse (1981 – 1992): The world’s greatest Mouse detective Danger Mouse with his trusty sidekick Penfold achieved cult status and in 1983 viewing figures topped 21 million!”
But we can go further back, and to a rather more primary source to boot. The old Cosgrove Hall website – now long gone, but preserved on the Wayback Machine – has this to say about Danger Mouse, published right back in 2002:
“At one stage in early 1983 Dangermouse viewing figures hit an all time high of 21.59 million viewers. In the same week the movie Superman managed a mere 16.76 million!”
Which suddenly gives us some extra information to work with. We have a very specific figure of 21.59 million, and – crucially – we now know that Superman was broadcast in the same week as the supposedly record-breaking Danger Mouse figures.
Superman – its UK television premiere, no less – was broadcast across ITV on the 6th January 1983. And Danger Mouse was also on that week: in fact, it was the opening episodes of Series 4.1 Between the 3rd – 7th January 1983, the five part serial “The Wild, Wild, Goose Chase” were broadcast. And all of a sudden, we’re not waving vaguely at “21 million viewers in 1983” – we have a very specific week we can investigate.
Reader, I have investigated. I have gone beyond the annual figures on the BARB website, and asked them for anything they could provide for this specific week. Incredibly, they actually indulged me. Here is the Top 10 programmes for ITV, for the week ending 9th January 1983 – figures not publicly available anywhere else online, as far as I am aware:
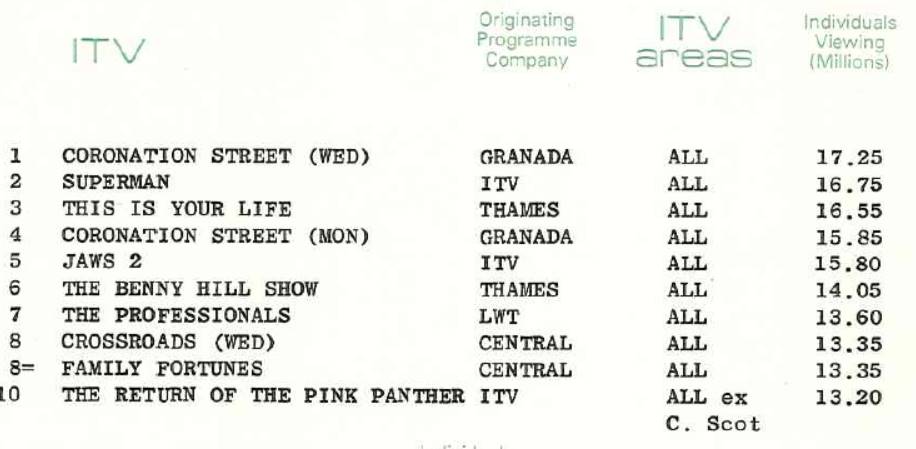
Danger Mouse is nowhere on that list. Moreover, the top-rated programme of the week – Coronation Street – had viewing figures of 17.25 million, significantly below 21.59 million. As far as I am concerned, case closed. Danger Mouse wasn’t pulling in viewing figures of 21 million viewers. It wasn’t even close.
As to why Cosgrove Hall were claiming that figure… I can’t say. 21.59 million is an extremely specific number. Moreover, Cosgrove Hall’s claim of Superman getting 16.76 million is pretty much correct.2 It is rather tempting to suggest that somebody with a dodgy grasp of mathematics added up all the figures throughout the five episodes shown that week, and that each episode got a rather more reasonable 4.3 million instead. Sadly, BARB seem to have no record of Danger Mouse figures at all from 1983, so there’s no way of proving or disproving that theory.
Other potential solutions are available. Maybe the 21 million includes overseas viewing figures. Or, y’know, maybe the decimal point is just in the wrong place. Who knows? All I know is that Danger Mouse very much did not beat Superman, at least on its own terms.
I will, then, leave you with one final thought. Recently I received copies of the 1984 and 1985 Danger Mouse annuals. If the show had been getting 21 million viewers back in 1983, you would think there would have been at least some mention somewhere in those annuals. Frankly, you’d expect it plastered across the front cover.
There is nothing.
Danger Mouse didn’t get viewing figures of 21 million. Tell your friends.
UPDATE (9/11/21): The great thing about writing this site is that I can put together an article, fail to quite reach the end of the story, and then have a reader step in and do the final part for me.
So many thanks to Anthony Forth, who has done some further research on all this, and actually managed to prove what we all suspected. Consulting the full BARB Weekly Report for the week ending 9th January 1983 – available at the BFI library – the viewing figures for the Danger Mouse episodes in question are as follows:
- Mon 3 Jan: 7.281
- Tues 4 Jan: 2.524
- Wed 5 Jan: 2.980
- Thu 6 Jan: 4.105
- Fri 7 Jan: 3.985
Those figures add up to 20.875 million. Which doesn’t quite match the 21.59 million that Cosgrove Hall quoted, but is very much near enough to conclusively prove where the erroneous 21 million figure came from. And let’s be very clear about this: it is erroneous. You don’t get to add together your five different episodes across the week, and say you beat a single showing of anything else. That’s not how viewing figures work.
Anthony also points out that the Bank Holiday Monday figure of over 7 million is very high for the series – twice that of what the BBC was getting at the same time, and more than the programmes which followed on ITV. His theory that this success got conflated and exaggerated over time into “beating Superman” seems to me to be a very sound one.
It’s also worth noting that the figures for the following week’s serial, “The Return of Count Duckula”, are as follows:
- Mon 10th Jan: 4.041
- Tue 11th Jan: 4.381
- Wed 12th Jan: 4.556
- Thu 13th Jan: 4.115
- Fri 14th Jan: 4.535
The total for this serial comes to 21.628 million… or more total viewers across the week than the supposedly famous serial in the same week as Superman. And with that, I think we can safely put this nonsense to bed.
After all: over 7 million viewers for the first episode of the serial is still pretty damn good for the slot. We don’t need to misrepresent anything for that to be considered a success. Danger Mouse did well enough without all that.
9 comments
William Keith on 18 September 2021 @ 11am
Maybe 21 million was the aggregated daily high figure for all CITV across its first week. That would have been worth a press release?
Daniel Webb on 18 September 2021 @ 3pm
I’m pretty sure programme’s had to be of a certain minimum length in order to even have their viewing figures measured in the first place (I presume that the thinking was that a very short programme following on in the schedule from a very popular one would get a wildly over-inflated figure as it would disproportionately benefit from people taking a few minutes to bother to change channel or switch off). Dangermouse had a 5 or 10 minute slot in that week, so it is unlikely that a viewing figure was ever measured.
The ITV viewing figures for that week would have been published in The Stage at the time, as they published individual charts for each of the four channels at that time (as well as regional top 10s, and sometimes charts for TV-AM and S4C) so the information is available publically, at least if you have the correct back issue of The Stage to hand. In theory the British Newspaper Archive has the a complete run of The Stage from it’s beginning’s and up to about 2006, but in practice a noticeable percentage of issues are missing on there, and as luck would have it the specific issue needed is one that is missing.
If Dangermouse did get a larger than normal audience at any point that week then it was most likely the Bank Holiday Monday edition, being as it followed the movie Zulu and was probably promoted as the first of the new series, but even Zulu itself is not in the top 10 for the week, so even if it benefitted from ‘run off’ from Zulu’s audience, and even if it’s own audience was in fact measured, there could only have been less then 13.2 million people who didn’t bother to change channel after Zulu and thus ‘watched’ the entire episode of dangermouse.
Simon Coward on 18 September 2021 @ 5pm
I have no info for 1983 but, by 1985, viewing figures for Danger Mouse were regularly falling somewhere in the range 3.5 to 5.5 million, with the series often creeping into the lower reaches of the weekly Top 100.
On that basis, and I realise it’s hardly any kind of proof, then an average of 4.3 million per episode would seem perfectly plausible.
Zoomy on 18 September 2021 @ 5pm
I’m pretty sure it was normal to add together the numbers for anything that was shown more than once in a week, at one point. It seems logical that someone, somewhere must have added a week’s worth of numbers together and the total came to the attention of someone at Cosgrove Hall… but I think I prefer to believe the myth! I’d rather watch DM than Corrie, any day!
Simon Coward on 19 September 2021 @ 12am
It was normal to add together the numbers when the same episode of the same programme was shown twice in one week (which generally meant adding the initial broadcast’s figures to those of an omnibus repeat) but never (to the best of my knowledge) would they add together the figures for two different episodes.
What generally did happen, by that point in the 1980s, was that for programmes with more than one episode a week the figure for the highest-rating episode would be taken and added to that of the in-week repeat, if there was such a thing, and that sum would be used to determine the programme’s position in the chart.
If something like Coronation Street with a chart of figure of, say, 15 million had actually been made up of two 7.5 millions – one from Monday and one from for Wednesday – that would mean that the episodes individually wouldn’t have even made the Top 50 most weeks, which stretches credibility well beyond breaking point.
John Hoare on 19 September 2021 @ 6am
This is an extremely good point, and I also had the idea at the back of my head that a five minute show would be unlikely to ever be measured.
Which really does make the whole thing even more confusing. An aggregate figure across the week seemed the most likely answer to this whole question: but if the figures were never even measured, where the hell does the very specific 21.59m figure even come from?
Simon Coward on 19 September 2021 @ 12pm
I dare say that there has always been some kind of lower duration for measurement purposes, and it wouldn’t surprise me if the cut-off was higher during the more ‘analogue’ period of recording the info e.g. when log books and the like were in operation.
I can tell you with absolutely certainly that by 1985, five-minute programmes were being measured as I’m looking at a Top 100 for a week in February that year and at #100 in the chart is ‘The Moomins’, which at that point was running five days a week, from 4.15 to 4.20.
Adam Bowie on 27 September 2021 @ 12pm
While I’m not a BARB historian, I would very much suspect that ratings data that BARB collected in the early 80s would have been based on paper diaries kept by BARB respondents. And those diaries wouldn’t have had programme titles included. It’s likely that times were broken down into 15 minute periods, and diarists just had to record which channel they were watching and which 15 minute periods they were watching it (Plus other details like which other household members were also watching).
Schedules change, so you then align the diary data with the programmes that were actually being shown, in case something over-ran or whatever. That also means that you have quasi-data even for very short shows.
Don’t forget, a big part of the reason for viewing data is to work out advertising costs. Every break across the day has an audience and a value regardless of the shows around it.
Anyway, the two decimal point number suggests adding a week of episodes together as everyone else says. But the granular data to prove that might be hard/impossible to find.
There is one other way to get a “big” number, and that’s to work out how many people saw “at least” one episode over, say, a series. But in this instance, it looks like there was a very specific time frame – the week of the Superman premiere – being examined.
Joe Dredd on 29 September 2021 @ 3pm
I love that the petition calling for a DM statue is completely at odds with the supposed viewing figures. Out of 21 million people who are said to have watched it, how many want a statue? 150!
Comments on this post are now closed.